
R packages and functions
Published:
When I first started to learn R, I really struggled to understand the structure of code. To me, it looked like a lot of technical lingo and random placement of terms I’ve never seen before. It wasn’t until I had a break through that I began to understand the general structure and patterns to coding, so I want to share it with you all.
Warning: This post is contains a bit of network lingo. If you are not somewhat familiar, I highly suggest checking out Dr. Dai Shizuka’s blog. It is extensive and extremely helpful. I don’t want to reinvent the wheel with more network tutorials. My goal is to offer a different perspective on code and tutorials that could better help your understanding.
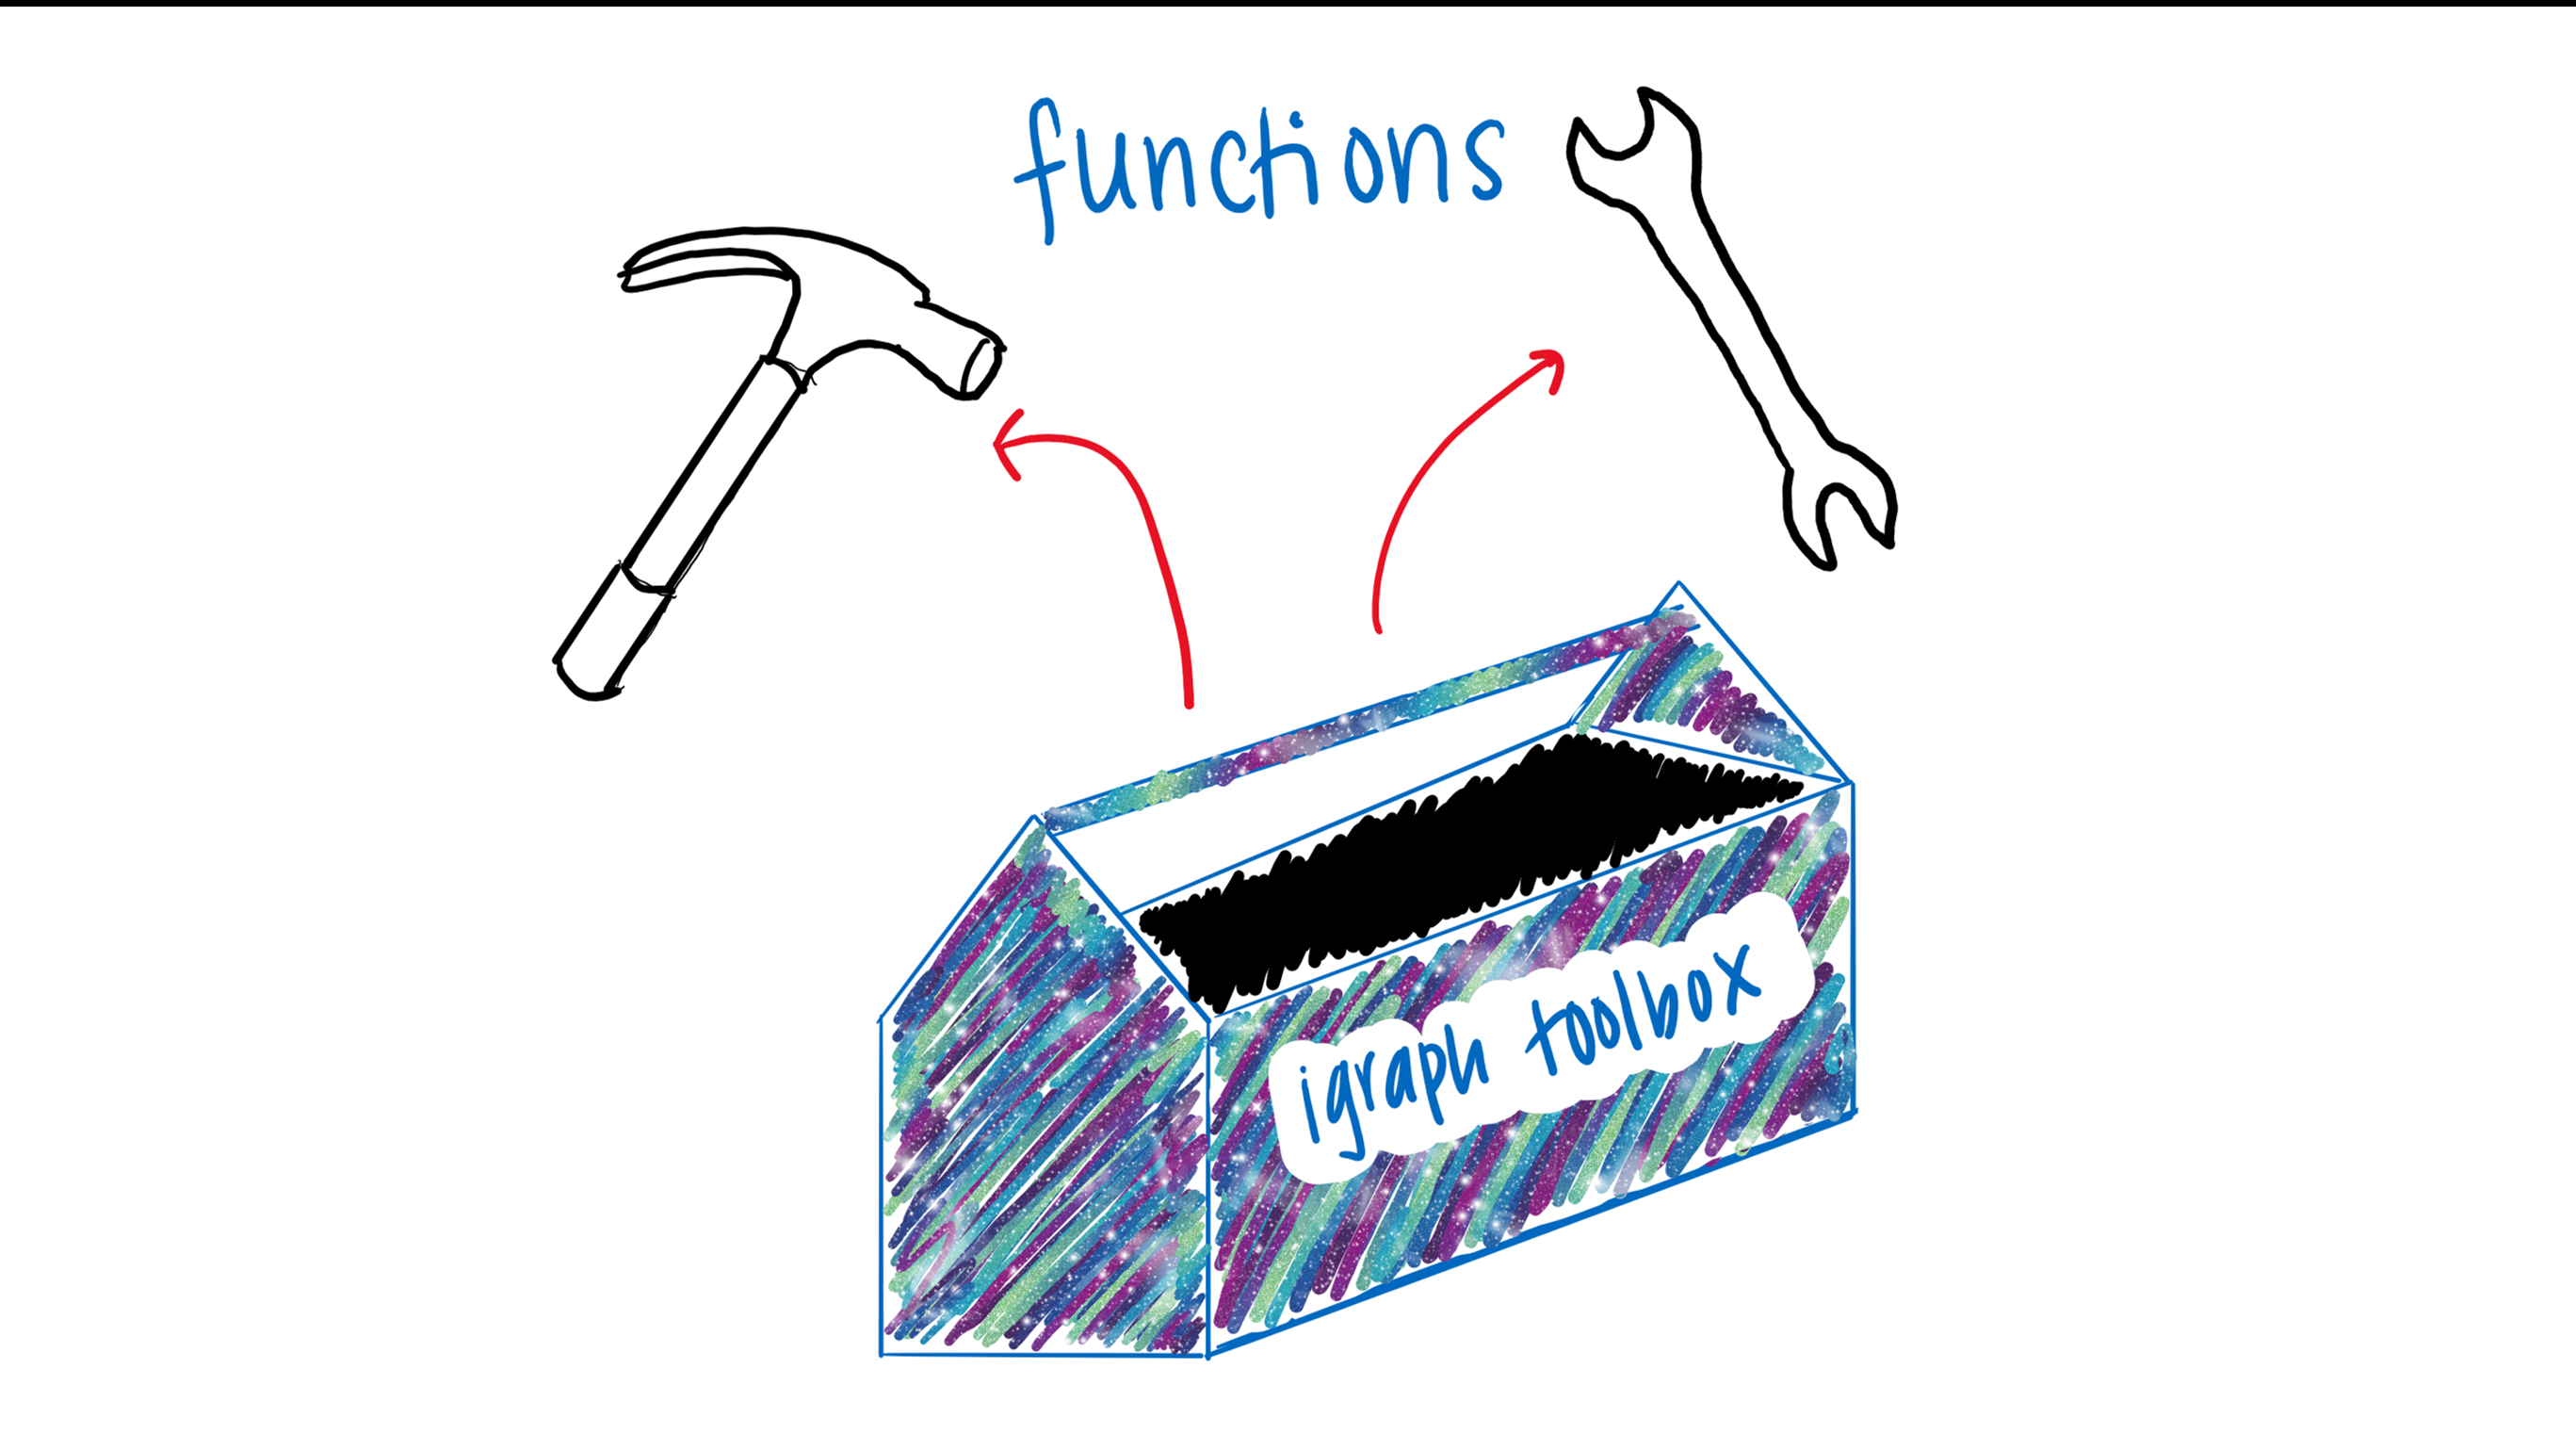
I’ll start with packages and functions! Plainly put, packages contain a bunch of different functions. Functions perform a particular function. I like to think of packages as a toolbox and functions as a tool. Since I think about networks a lot, we can use igraph as our example toolbox.
One of the first steps when you begin coding is to install and load packages that you will need. You can use the functions install.packages() and library()
install.packages("igraph")
library(igraph)
igraph is a collection of a bunch of different functions that are related to and helpful for network analysis. In terms of our metaphor, igraph is the toolbox and functions like degree() and graph_from_data_frame() are the tools. You can find a list of all the functions igraph can perform here.
So, in the same way you wouldn’t use a hammer to screw in screw, you wouldn’t use graph_from_data_frame(), which unsurprisingly outputs a graph from an data frame to find the degree of nodes in the network. You would use the tool degree().
We can start to see how helpful these tools are, but we also need to provide some information to make the tools useful. Back to our metaphor: if you need to hammer a nail into a block of wood, you have to provide the hammer with what it needs to do its job: block of wood and a nail!
That is to say a hammer doesn’t have anything to hammer without nails and wood. In the same way if you use a function like graph_from_data_frame() you have to supply it with the information it needs to accomplish its intended for, a dataframe.
Luckily, there is lots of documentation to tell you what the function needs in order to work. Let’s keep using graph_from_data_frame() as an example.
You can reference igraph’s website for this function. Its usage tells us what we need to include within our parenthesis and what we need to specify in order to get the function to do what we want.
graph_from_data_frame(d, directed = TRUE, vertices = NULL)
The arguements are the guts of the function, and they go in our parentheses. In this example, our arguements tell us that we need to input our data frame, specify whether it’s directed or not, specify whether or not the matrix is weighted, and whether we should consider vertices as attributes of nodes.
Let’s say I want to create a network from a data frame that contains data on the social relationships between penguins. I need tools to do this! As I’ve mentioned before there are dozens of ways we could go about this, but let’s keep it simple. Our tool in this case is the graph_from_data_frame() function from the igraph package.
Quick tip: you might see igraph::graph_from_data_frame(). This just specifies which package the function came from. Some functions from different packages (that do different things) have the same name. This way you can tell R exactly which “tool” from the right “toolbox” you want to use.
So, what does this function, or tool do? We can reference igraph’s website again, but essentially it outputs a network object that we can use to graph! Check out the example below:
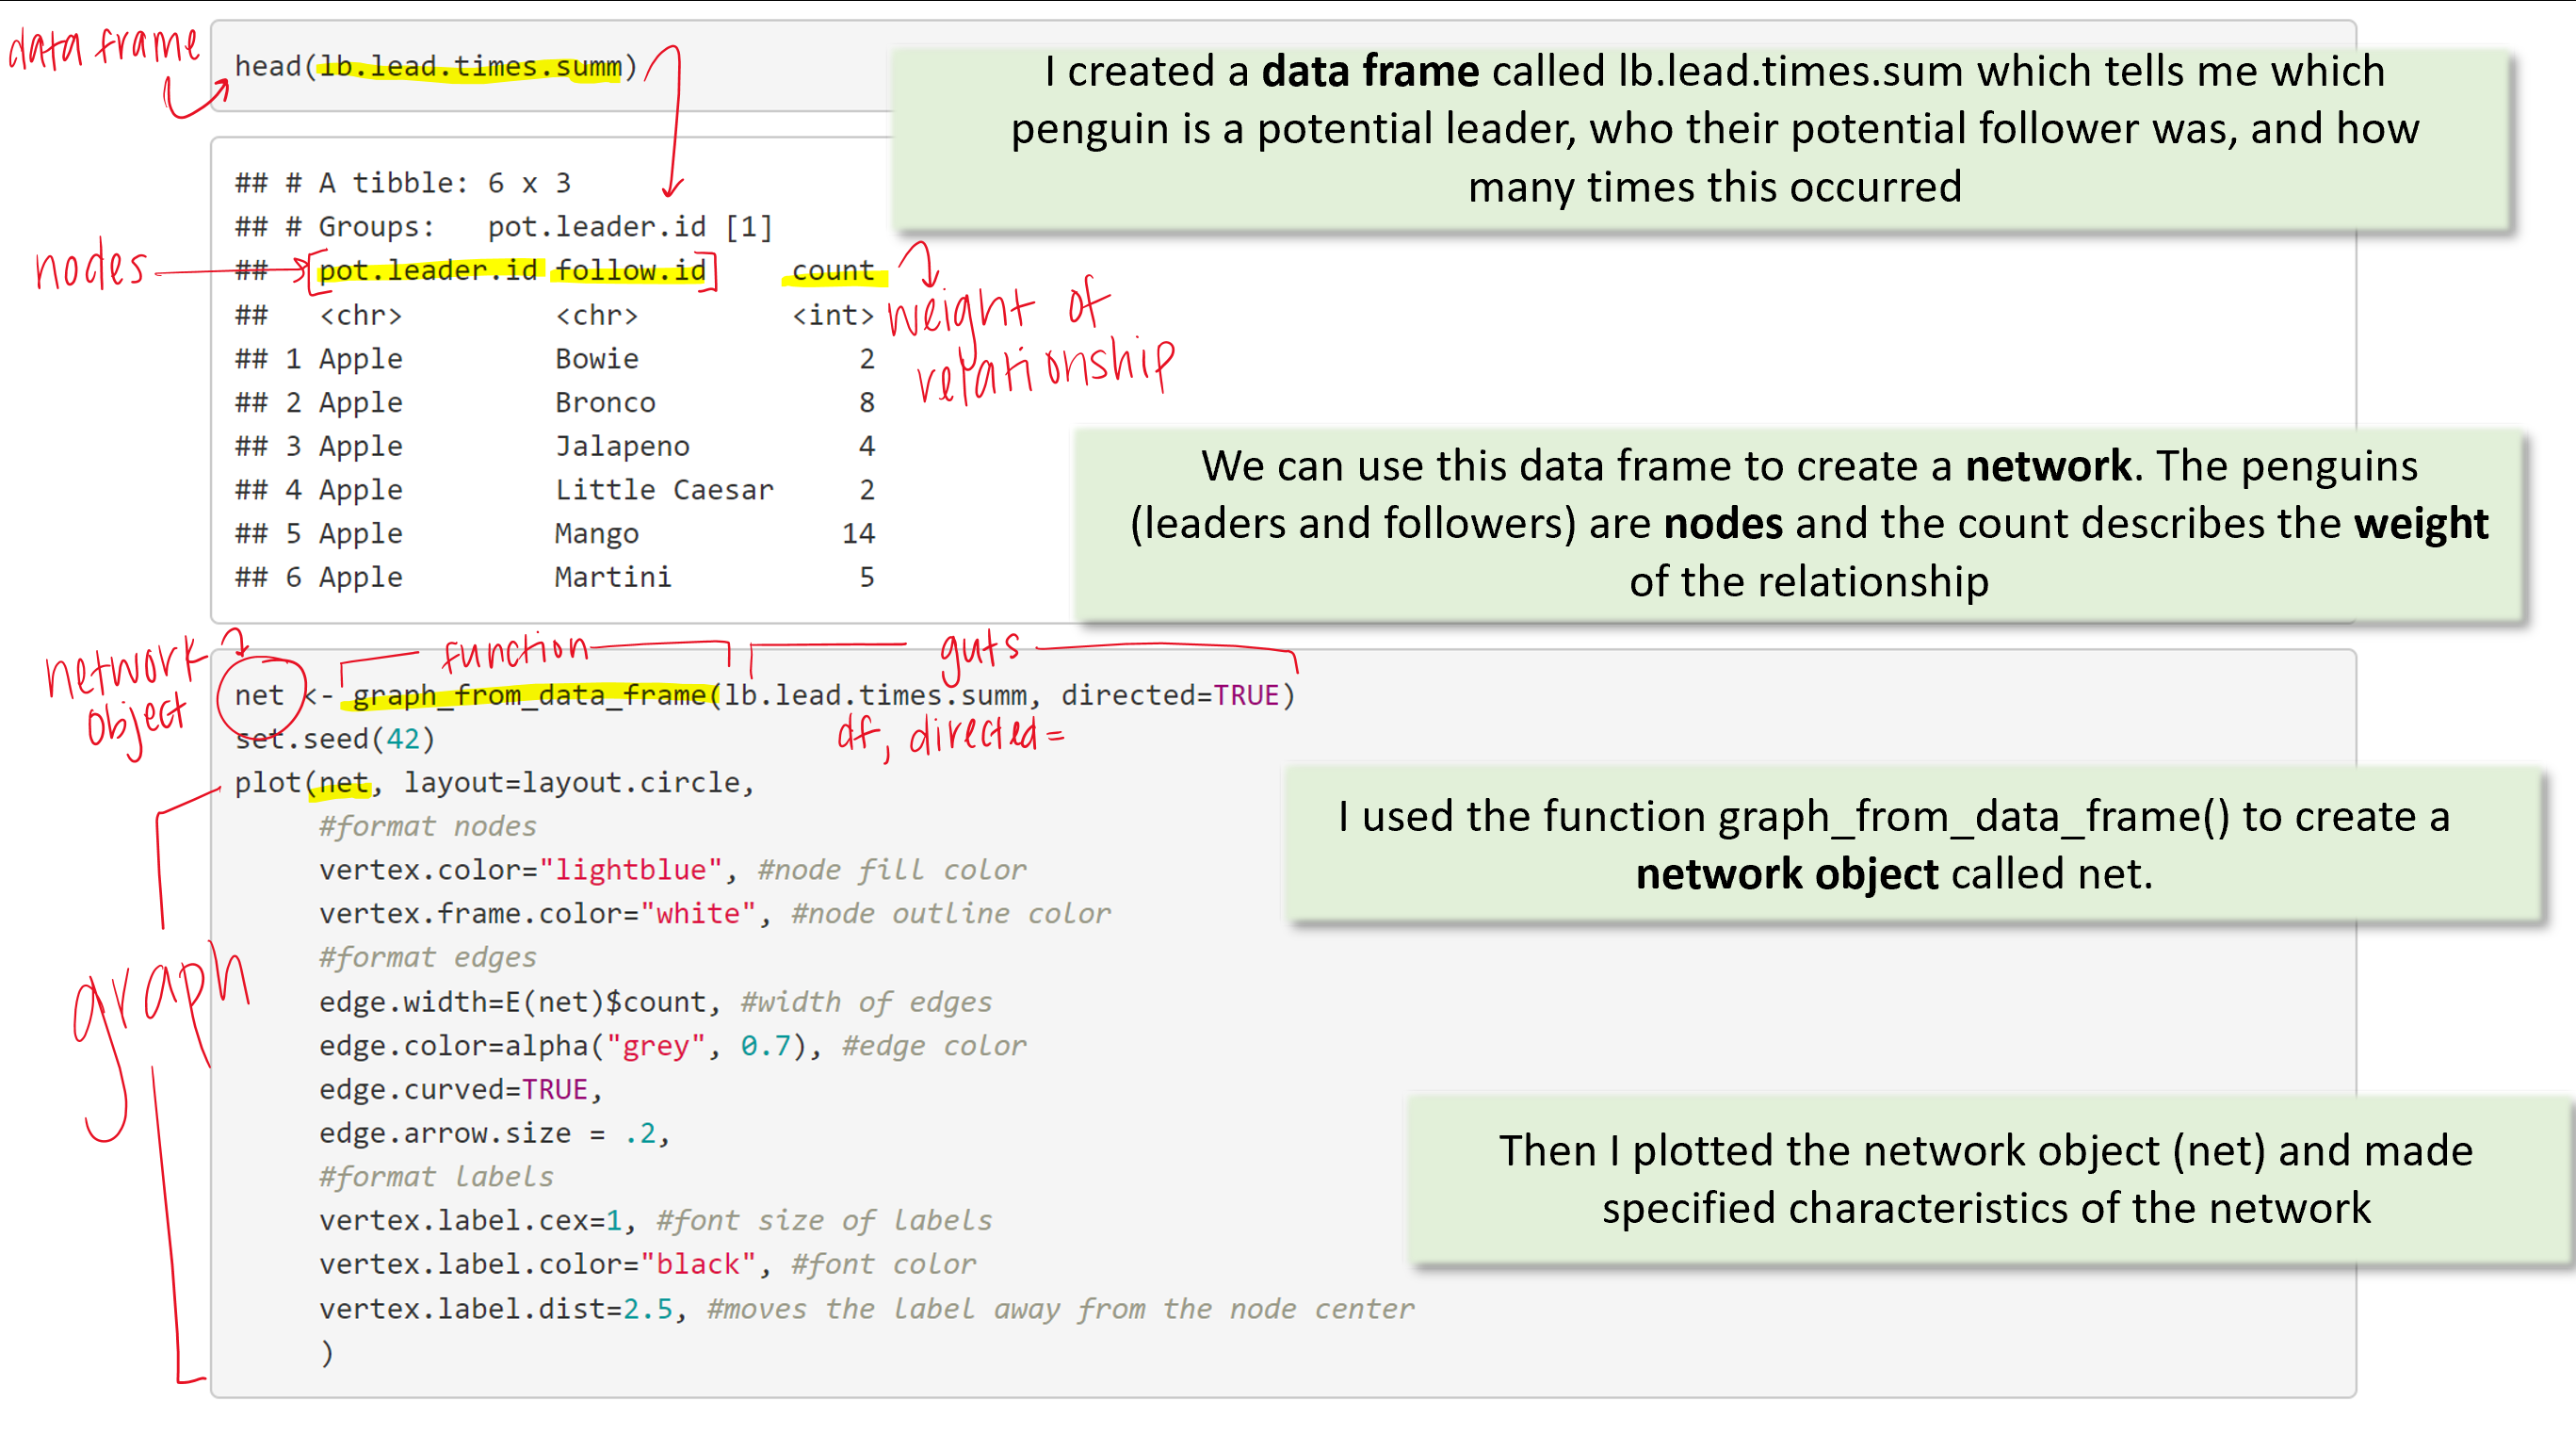
I start with a data frame called lb.lead.times.sum. It contains information I need for a network: nodes and edges. In this case, my nodes are penguins and my edges are the weighted relationship between the two nodes.
I use my handy, dandy function to get the network object I need in order to plot a network. I use the function plot(), yet another tool from our igraph toolbox, to help me plot my network.
Voilà:

Once I felt like I understood how packages and functions worked, I started to see more complex lines of code. Again, it seemed crazy to me to think that people typing out these long lines of code that accomplishes so much! How were they doing this? How do you even begin to create something so entricate?
The short answer is they don’t! The trick is tack on elements to code to make it more complex. Much like legos, you start with a foundational piece - a piece or two that are fundamental to the structure. Then you start to add the fancy peices that make it look nice!
With my lego metaphor in mind, let’s work through how we might make a pretty plot in R.
First, we need to use the skills we learned above but take it one step further. The tidyverse is a collection of packages - think a toolshed that houses a bunch of toolboxes that contain many tools. The core packages, like ggplot2 and dplyr, within the tidyverse are extremely useful and very common. You can install the entire tidyverse or just ggplot2. We are going to use ggplot2 to graph! Start with:
install.packages("tidyverse")
library(tidyverse)
install.packages("ggplot2")
library(ggplot2)
To graph using ggplot, you need a few basic elements
ggplot(df, aes(x = x-axis, y = y-axis) +
geom_bar(stat = "identity")
This your foundational lego - it is the minimum amount of code required to create a bar graph with ggplot. Notice the +. We use + to tack on extra “legos”. This could be functions like labs() to specify our labels, lims() to set our x and y limits, or scale_color_gradient() to create a gradient of color in our graph.
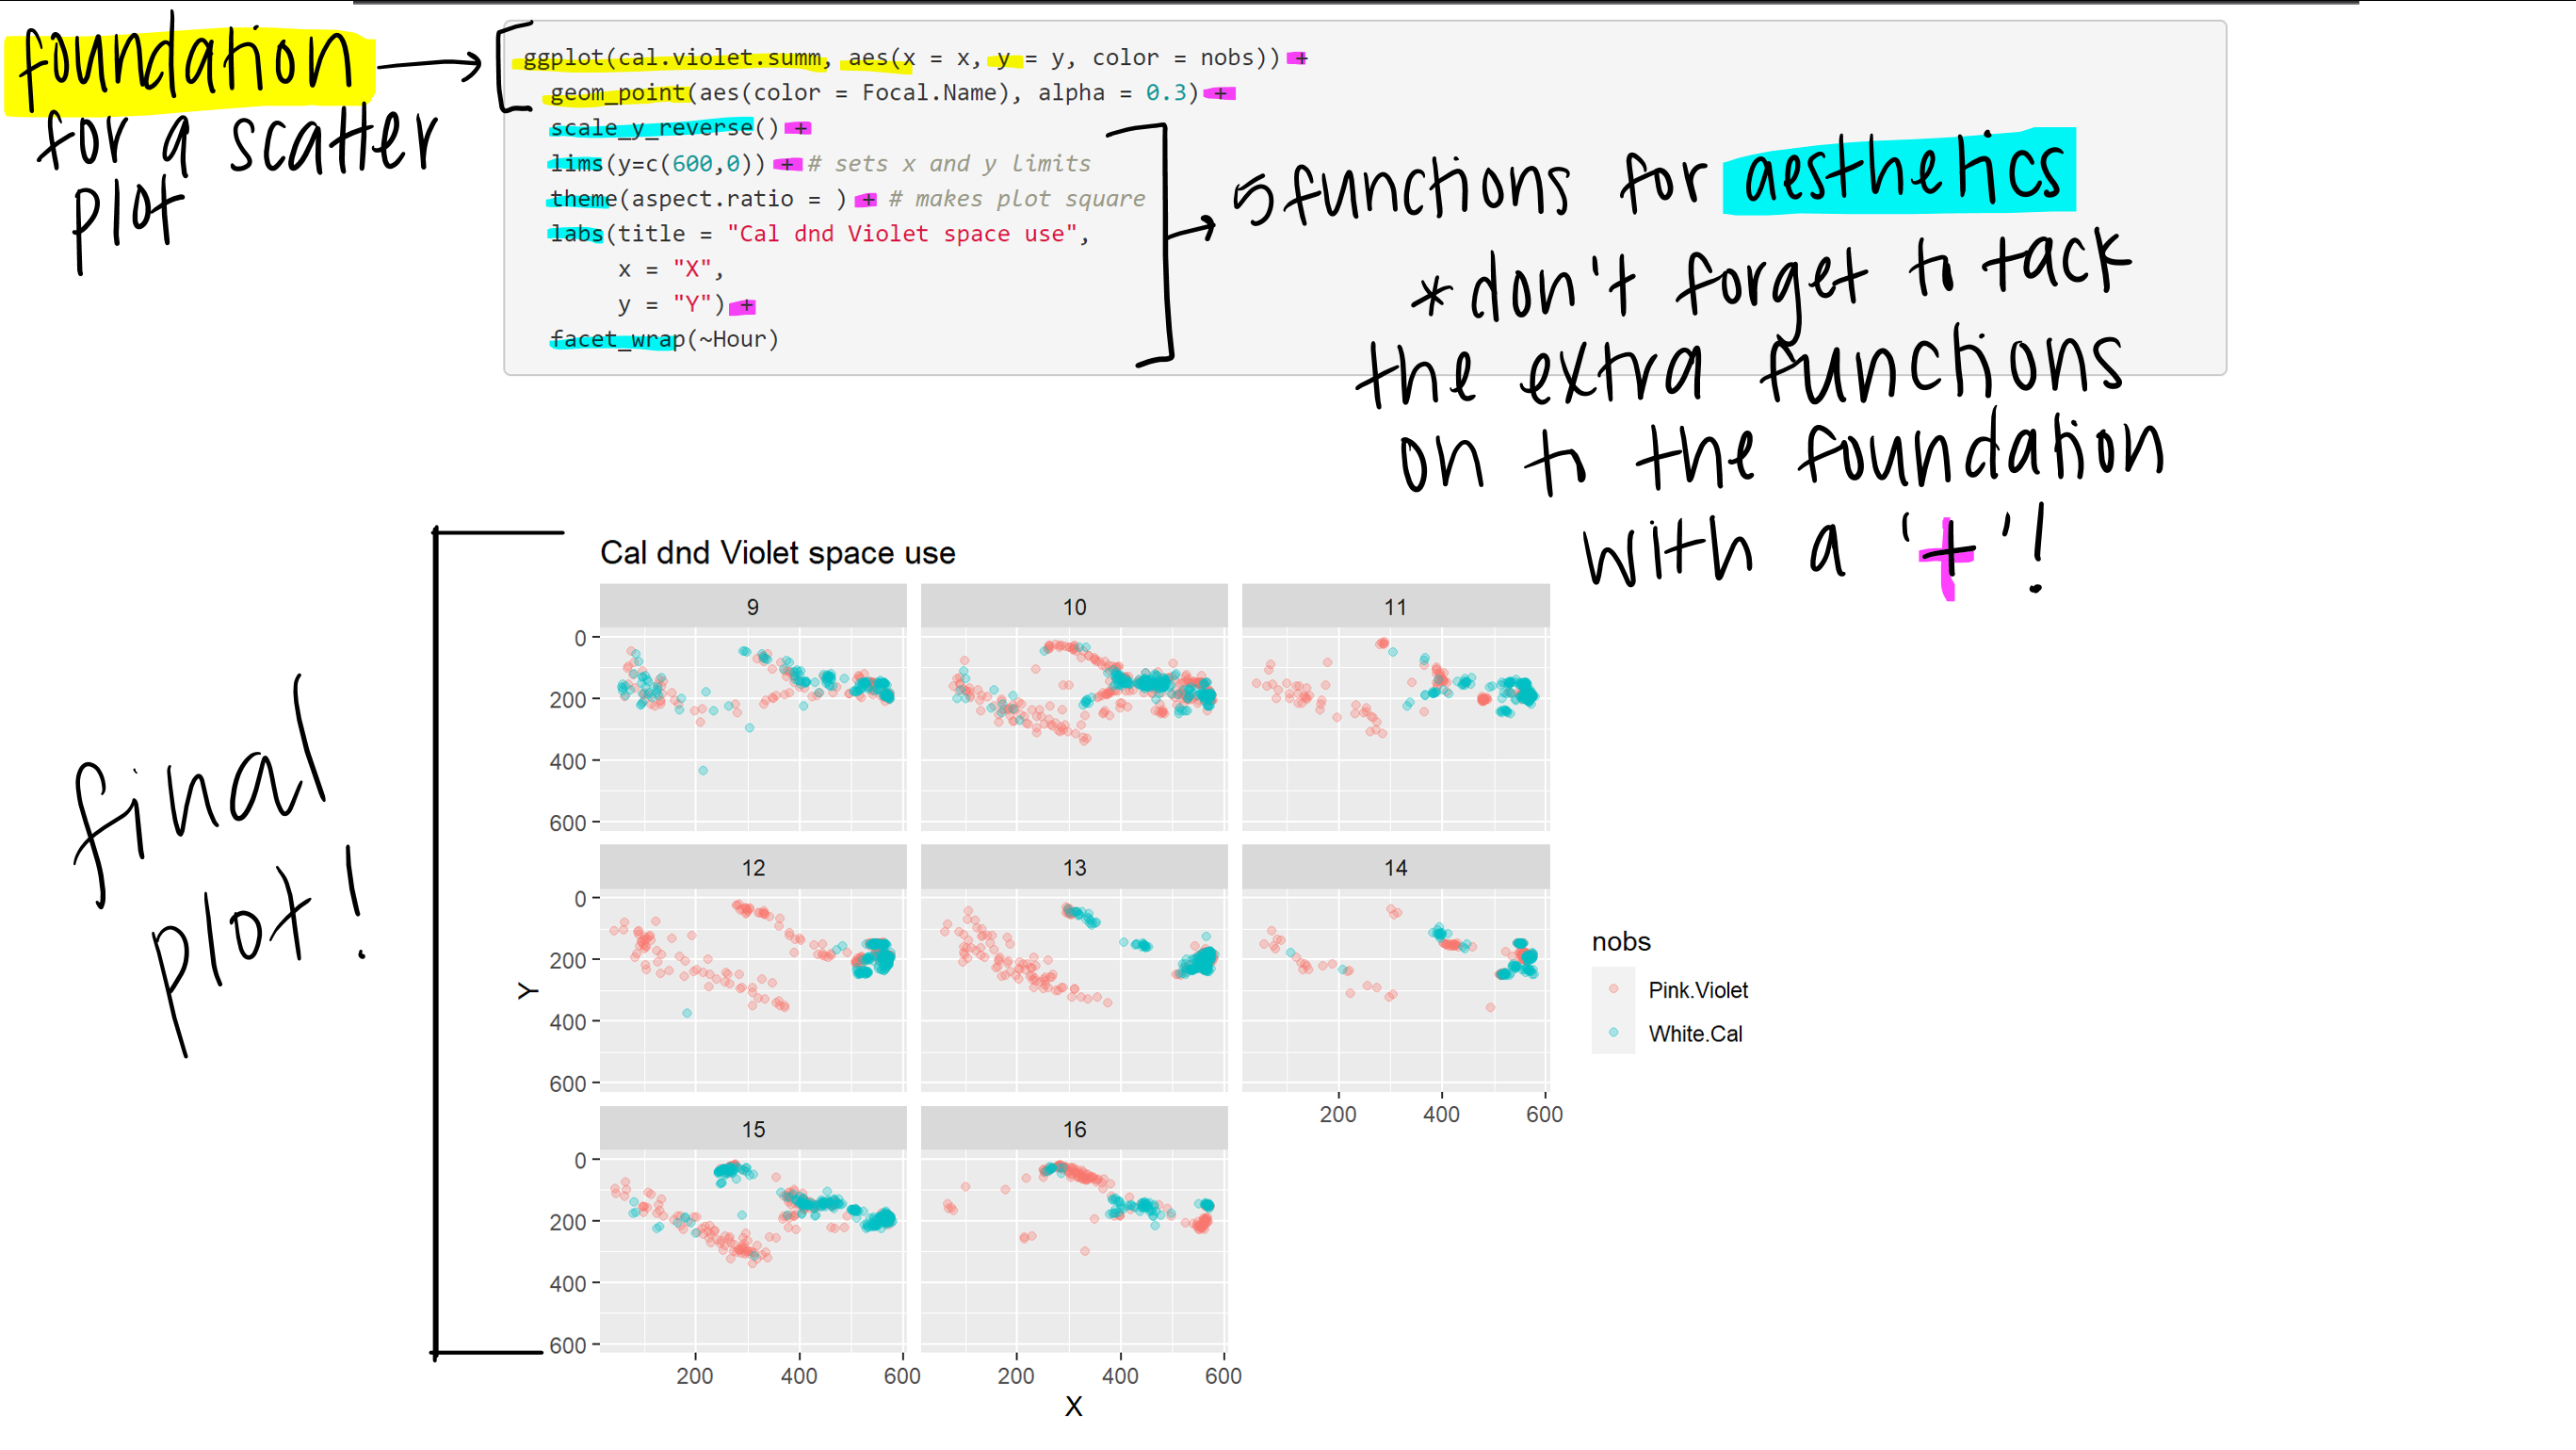
My point is, to avoid getting overwhelmed, start with the basics. Then figure out what you need to accomplish your goal! Again, having a plan or a clear goal is crucial to avoid the coding rabbit hole!
Pro-tip: Draw a sketch of what you want your plot to look like before hand to keep you on track